- What Are Credit Card Statistics?
- Highlights of Credit Card Usage in the U.S.
- Why Consumers Prefer Credit Cards
- Spending Patterns and Consumer Habits
- Economic Factors Impacting Credit Card Usage
- Credit Card Debt Details
- State-by-State Summary of Average Credit Card Ownership
- The Rising Threat of Credit Card Fraud and Identity Theft
- Fraud-Prone States in 2024
- Business Credit Card Adoption
- Digital Transformation of the Credit Card Industry
- Future of Credit Cards and Payment Technology
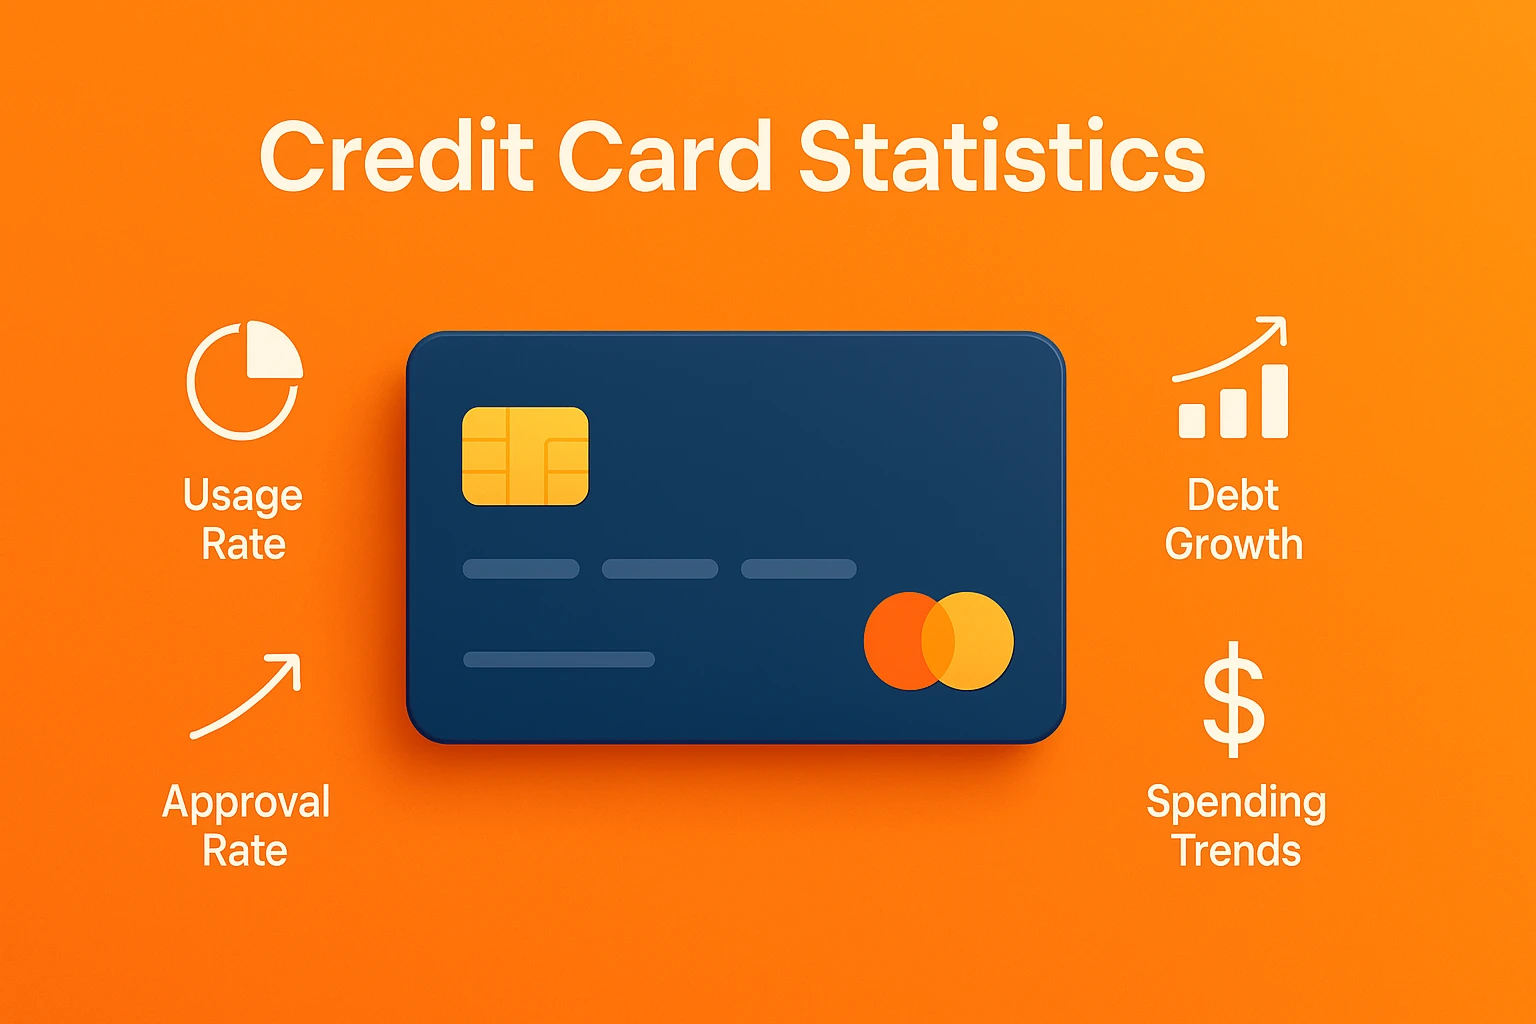
- Key Areas of Credit Card Statistics
- Final Thoughts
As of 2026, 82% of American adults had at least one credit card. By exposing patterns in spending, debt, and consumer behavior, credit card statistics provide a fascinating view into how Americans deal with their money. These figures demonstrate the important part that credit cards play in everyday transactions and the larger economy, from record-high average debts of $6,360 per borrower to interest rates that influence borrowing costs. We can learn how credit cards affect financial decisions and adjust to changing consumer habits by looking at ownership trends, financial impacts, and industry growth.
What Are Credit Card Statistics?
Credit card statistics provide a thorough understanding of credit card ownership, usage, and financial consequences. These data points cover important topics like average interest rates, habits of spending, debt levels, and the percent of the population that uses credit cards.
Important information includes the percentage of adults who own credit cards, the average amount of credit card debt per household, the total number of credit card accounts that are currently open, and patterns in the use of different credit card types. These figures contribute to a clear picture of how consumers behave and how the credit card market is changing.
Highlights of Credit Card Usage in the U.S.
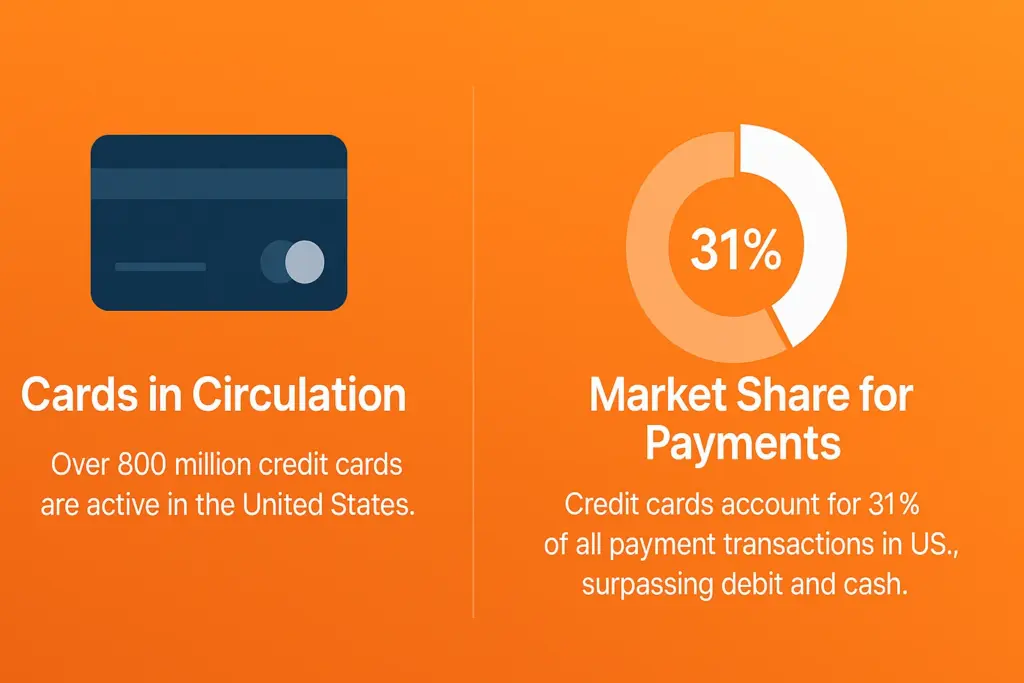
- Cards in Circulation: Over 800 million credit cards are active in the United States.
- Average Ownership: The typical American holds an average of 3.9 credit cards, indicating widespread adoption across most demographics. (Experian)
- Market Share for Payments: Credit cards account for 31% of all payment transactions in the U.S., surpassing debit cards and cash in market share. (Federal Reserve Bank of San Francisco)
- Growth in Spending: Annual spending on credit cards reached $3.2 trillion in 2022, achieving record growth despite economic uncertainties.
- Contactless Transactions: Over 50% of in-person global payments are now contactless, reflecting consumers’ shift towards faster and more convenient payment methods.
- Online Purchases: Nearly 69% of credit card transactions are through online platforms, with 32% of that coming from mobile devices.
Why Consumers Prefer Credit Cards
Credit cards offer unique advantages that set them apart from other payment methods:
- Speed and Convenience: Tap-to-pay functionality reduces transaction times by 63%, providing a seamless checkout experience.
- Fraud Protection: As per the Record of Federal Reserve Bank Of Atlanta Record, 77% of consumers choose credit cards over debit cards for their enhanced fraud protection features.
- Reward Incentives: General-purpose credit card users earn rewards averaging 1.6 cents per dollar spent, making credit cards attractive for frequent use.
- Building Credit History: Younger generations use credit cards as a financial tool, with 41% of Gen Z and 40% of Millennials focusing on building their credit history.

Spending Patterns and Consumer Habits
Examining credit card spending reveals interesting behavioral insights:
- Carrying Balances: Acc. to a May 2024 Federal Reserve Report, Fewer than 47% of adult credit card users carried over balances in the last 12 months, suggesting that most use credit cards responsibly.
- Spending on Restaurants: Credit cardholders account for 33% of restaurant transactions, equating to nearly $30 billion annually in spending.
- Holiday Expenses: More than 80% of Americans relied on credit cards to fund holiday purchases in 2024.
- Sector-Wise Breakdown: Credit cards are used extensively for dining, entertainment, and online shopping, highlighting their versatility.
Economic Factors Impacting Credit Card Usage
Economic changes are shaping how consumers interact with credit cards:
- Inflation’s Role: Rising costs have pushed 18% more middle-income households to use credit cards for daily needs.
- Debt Totals: Total U.S. credit card debt reached an all-time high of $1.17 trillion in early 2026, with an average household debt of $11,303.
- Interest Rates: The average credit card APR is now 21.37% for all accounts and 24.23% for new credit card offers, demonstrating higher borrowing costs.
Credit Card Debt Details
Americans continue to grapple with rising credit card debt:
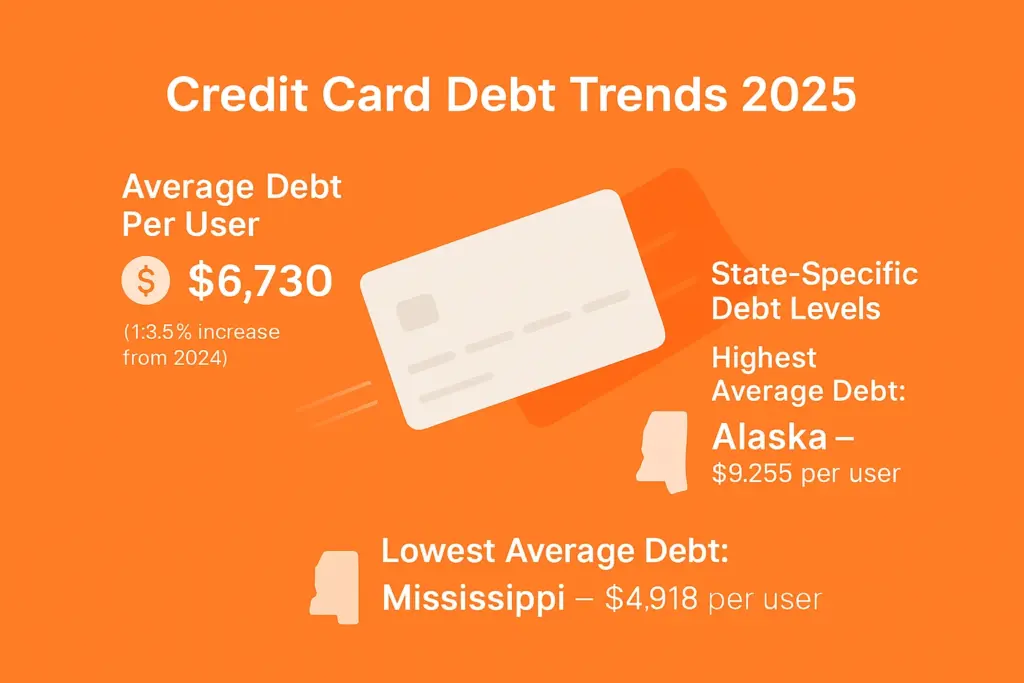
- Average Debt Per User: The average credit card debt rose by 3.5% in 2026, reaching $6,730 per user. (Experian Credit Report)
- State-Specific Debt Levels
- Highest Average Debt: Alaska, at $9,255 per user.
- Lowest Average Debt: Mississippi, at $4,918 per user.
Top 10 States with the Highest Credit Card Debt (2026)
| Rank | State | Average Debt (USD) |
| 1 | Alaska | $9,255 |
| 2 | District of Columbia | $9,124 |
| 3 | Maryland | $9,047 |
| 4 | New York | $8,920 |
| 5 | New Jersey | $8,803 |
| 6 | Georgia | $8,663 |
| 7 | Florida | $8,637 |
| 8 | California | $8,559 |
| 9 | Connecticut | $8,416 |
| 10 | Nevada | $8,378 |
State-by-State Summary of Average Credit Card Ownership
| Rank | State | Avg. Cards per User |
| 1 | New Jersey | 3.24 |
| 2 | North Carolina | 3.22 |
| 3 | Delaware | 3.18 |
| T-3 | Texas | 3.18 |
| 5 | Nevada | 3.17 |
| 6 | Maryland | 3.15 |
The Rising Threat of Credit Card Fraud and Identity Theft
The growing use of credit cards has led to increased fraud cases and identity theft:
- Global Fraud Losses: Expected to exceed $43 billion by 2026.
- Types of Fraud: Account takeover fraud is the most common, constituting 33% of all incidents.
- E-Skimming Growth: Online card skimming incidents increased by 350% from 2022 to 2023, emphasizing vulnerabilities in e-commerce platforms.
Fraud-Prone States in 2024
According to the Federal Trade Commission, Florida had the highest number of fraud reports per capita.
| Rank | State | Fraud Reports Per Capita |
| 1 | Florida | 24.81 |
| 2 | Georgia | 23.41 |
| 3 | D.C. | 22.39 |
| 4 | Nevada | 20.40 |
| 5 | California | 17.33 |
Business Credit Card Adoption
Corporate credit card adoption has grown across industries:
- Usage by Small Businesses: 83% of small businesses use credit cards for operational expenses.
- Spending Trends: Businesses spend an average of $13,000 monthly per card, underscoring the importance of credit cards for cash flow management.
- Time Efficiency with Automation: Businesses leveraging expense automation have reduced reporting times by 30-40%.
Digital Transformation of the Credit Card Industry
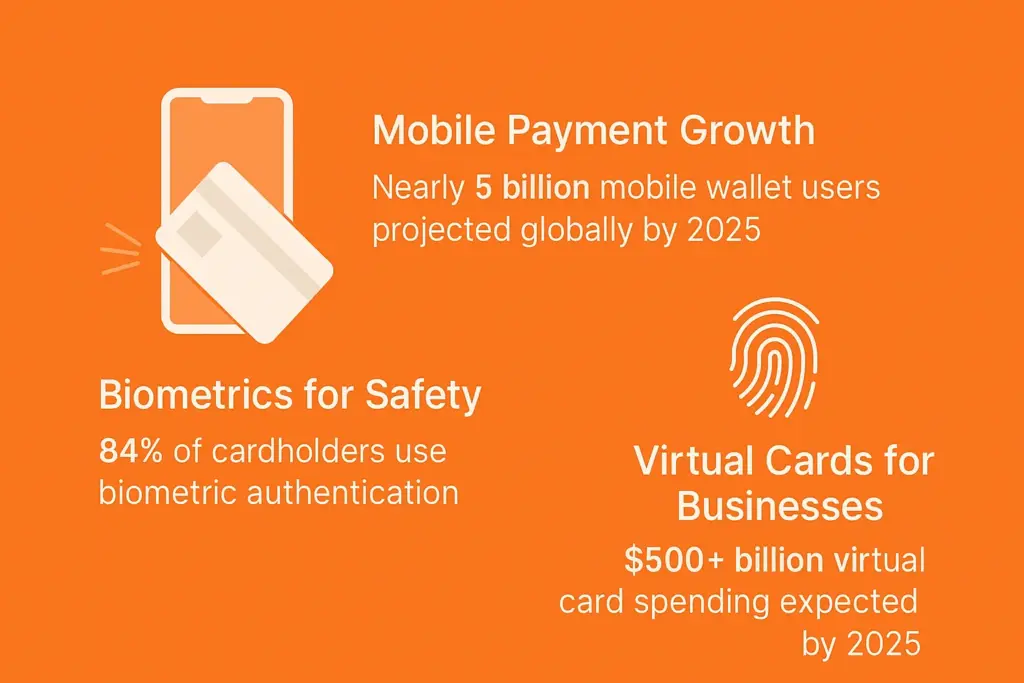
- Mobile Payment Growth: Mobile wallet adoption is projected to grow to nearly 5 billion users by 2026 globally.
- Biometrics for Safety: 84% of cardholders use biometrics (e.g., fingerprints) for payment authentication.
- Virtual Cards for Businesses: Virtual card spending is expected to exceed $500 billion by 2026.
Future of Credit Cards and Payment Technology
The road ahead points to innovative transformations:
- Quantum-Resistant Cards: These cards aim to protect users against emerging threats in the digital space.
- AI in Fraud Prevention: AI systems are already reducing fraud detection errors by 40-60%, offering reliable safety enhancements.
Key Areas of Credit Card Statistics
Understanding consumer behavior, financial health, and the changing dynamics of the credit card industry all depend on credit card statistics. In a financial environment that is changing quickly, these insights enable businesses, consumers, and legislators to make wise decisions. The main categories of credit card statistics are broken down here:
1. Credit Card Ownership and Usage
- Adoption Rates: Credit card data shows how many cards are in use overall, indicating how widely adopted a particular area or group of people is.
- Spending Patterns: Information on total credit card spending reveals transaction volume and customer behavior.
- Transaction Frequency: Information about the frequency of credit card payments shows how dependent people are becoming on online transactions.
- Entry Levels: The portion of the population with credit cards demonstrates adoption across a range of income and demographic groups.
2. Financial Aspects of Credit Cards
- Interest rates: Average Annual Percentage Rates, or APRs, give consumers a clear picture of how much borrowing will cost.
- Debt Levels: Data on outstanding balances and the percentage of users with debt draw attention to both possible hazards and financial health.
- Benefits and Rewards: Information about points, cashback, and other rewards programs supports customers in comparing the costs of various credit cards.
3. Industry Trends and Growth
- Market Expansion: The credit card industry’s compound annual growth rate (CAGR) indicates how quickly it is expanding both domestically and internationally.
- Issuer Market Share: Knowledge of the competitive environment reveals which issuers control the majority of the market.
- Recent Changes in Trends: Credit cards’ changing role in modern finance is demonstrated by the growth of digital payments, contactless transactions, and e-commerce.
4. Regional and Global Examples
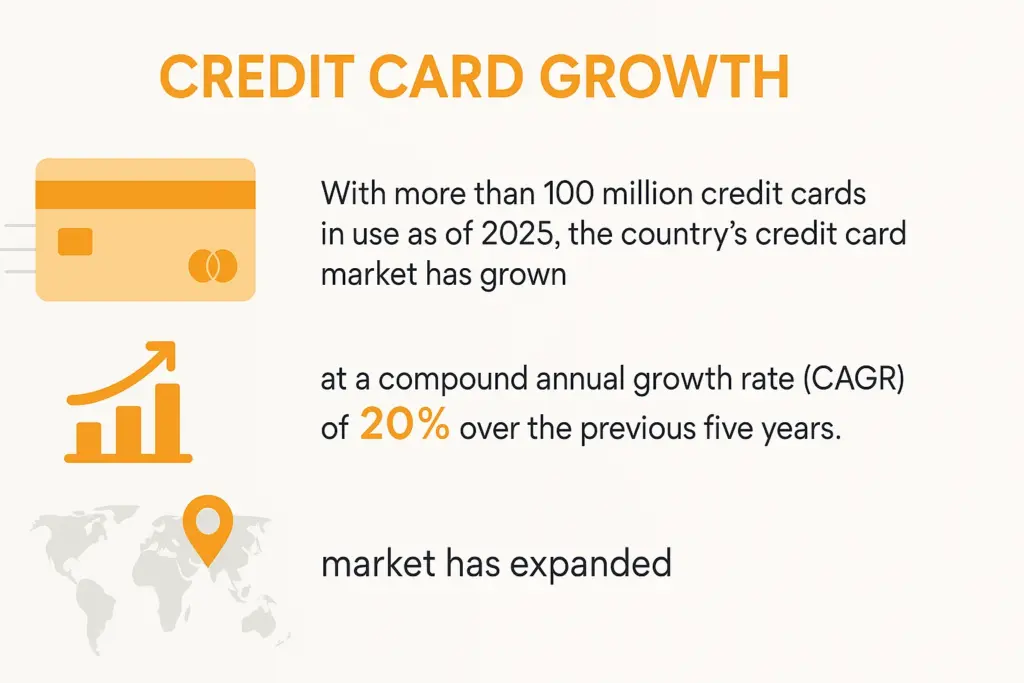
- India: With more than 100 million credit cards in use as of 2026, the country’s credit card market has grown at a compound annual growth rate (CAGR) of 20% over the previous five years.
- United States: Due to severe financial difficulties following the pandemic, credit card debt in the country has risen to over $1.2 trillion.
- Online Shopping: Credit cards continue to be the most widely used payment method for online purchases, underscoring their significance in the digital economy.
5. Demographic Insights
- Variations in Ownership: Credit card ownership is more common among households with higher incomes and among people with higher levels of education.
- Usage by Age: Across all age groups, credit card usage is steadily rising, with young adults frequently using them for the first time.
- Ethnic and Cultural Trends: Due to cultural and economic influences, ownership and usage rates differ among ethnic groups.
6. Payment Preferences and Trends
- Evolution from Cash: While cash transactions are still declining, credit card usage has been increasing consistently.
- Online vs. In-Person: Due to their flexibility, credit cards are becoming more and more popular for both online and in-person transactions.
Final Thoughts
From consumer behavior to worldwide market trends, credit card statistics are crucial for comprehending the financial environment. They empower companies to improve their strategies, assist consumers in selecting the best financial tools, and assist legislators in creating frameworks for financial stability and expansion.
By examining the main topics discussed above, we get to know about how credit cards influence economies and present chances for creativity. In an increasingly credit-driven world, these statistics provide a road map for better decision-making for consumers, business owners, and industry experts alike.
Create Invoices Instantly – Free & Easy!
Generate professional invoices in seconds with our Free Online Invoice Generator.
👉 Try the Invoice Generator Now