
More than half of all B2B invoiced sales in the United States are currently overdue. U.S. businesses collectively hold an estimated $825 billion in outstanding receivables at any given time, with roughly 15–20% classified as overdue by 30+ days. Global working capital reached its highest level since 2008 in early 2025, climbing to 78 days — intensifying cash flow pressure for businesses of every size.
The State of Accounts Receivable in 2026 (Key Headline Stats)
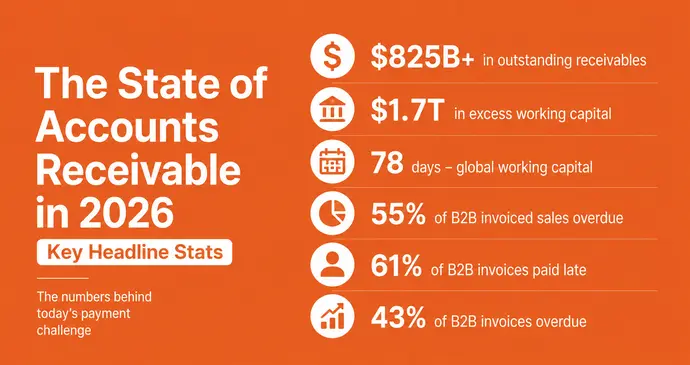
The accounts receivable landscape in 2026 is defined by one uncomfortable truth: getting paid on time has become the exception, not the rule. Here are the numbers that set the stage:
- $825 billion in outstanding receivables are held by U.S. businesses at any given moment (Crestmont Capital, 2026)
- $1.7 trillion in excess working capital is currently trapped in U.S. businesses (Quadient, 2025)
- 78 days — global working capital reached this level in early 2025, the highest since the 2008 financial crisis (Quadient, 2025)
- 55% of all B2B invoiced sales in the U.S. are currently overdue (The Kaplan Group, 2025)
- 61% of B2B invoices are paid late in the United States (Crestmont Capital, 2026)
- 43% of B2B invoices were overdue for U.S. companies in 2025, with roughly 5% of long-overdue invoices written off (Quadient, 2025)
- Nearly half of all B2B invoices across North America remain overdue; bad debts account for roughly 6% of credit sales (Quadient, 2025)
- 56% of U.S. small businesses report being owed money from unpaid invoices, with an average outstanding amount of $17,500 per business (QuickBooks, 2025)
- 34% of U.S. businesses say the average time it takes to get paid has increased over the past year (Quadient, 2025)
- 86% of businesses report that at least 25% of their monthly invoiced sales are currently overdue (The Kaplan Group, 2025)
- 81% of businesses have seen an overall increase in delayed payments (DocuClipper, 2025)
- Average B2B invoice payment time: 47 days, versus the standard 30-day terms that most businesses expect (Medium / Credit Management Review, 2025)
These figures aren’t outliers — they reflect a structural payment crisis that makes robust AR management one of the highest-leverage financial disciplines a business can adopt.
AR Aging Statistics
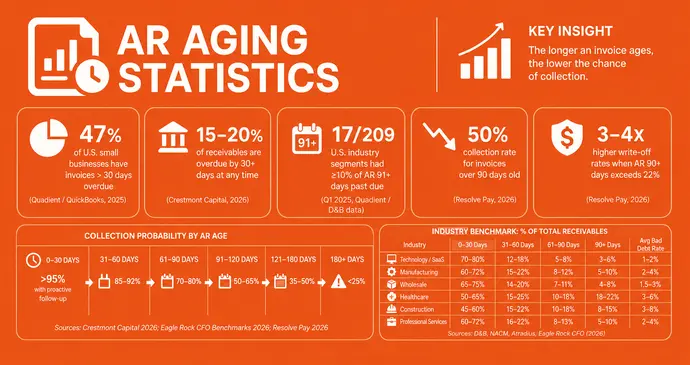
Accounts receivable aging tracks how long invoices have been outstanding. It is the most revealing indicator of collection health — and the data in 2025–2026 is sobering.
Current AR Aging Distribution Data
- In Q1 2025, 17 out of 209 U.S. industry segments reported that at least 10% of their receivables were 91 days or more past due (Quadient citing D&B data, 2025)
- In Q2 2025, 15 out of 203 U.S. industry segments still had at least 10% of their receivables aged 91+ days (Quadient, 2025)
- 47% of U.S. small businesses say at least some invoices are more than 30 days overdue, with nearly 1 in 10 invoices in this category (Quadient / QuickBooks, 2025)
- 15–20% of outstanding receivables in the U.S. are classified as overdue by 30+ days at any given time (Crestmont Capital, 2026)
Collection Probability by AR Age
The probability of collecting an invoice drops sharply once it ages past 30 days. This is one of the most important — and least-discussed — facts in AR management:
| AR Age Bucket | Approximate Collection Probability |
|---|---|
| 0–30 days (Current) | >95% with proactive follow-up |
| 31–60 days | 85–92% |
| 61–90 days | 70–80% |
| 91–120 days | 50–65% |
| 121–180 days | 35–50% |
| 180+ days | Under 25% |
Source: Crestmont Capital 2026; Eagle Rock CFO Benchmarks 2026; Resolve Pay 2026
Key AR Aging Benchmarks
- Historical data shows accounts over 90 days old have collection rates as low as 50% — meaning half of these receivables may never convert to cash (Resolve Pay, 2026)
- Companies with over 30% of AR in the 90+ day bucket often experience cash flow shortages and struggle to meet operational expenses (Resolve Pay, 2026)
- Companies that maintain AR over 90 days above 22% of total receivables experience write-off rates 3–4 times higher than those with better aging profiles (Resolve Pay, 2026)
- Healthcare practices benchmark AR over 90 days at 18–22% of total receivables as the performance threshold (Resolve Pay, 2026)
- Construction and healthcare consistently show the worst aging profiles due to long project cycles and insurance processing delays (Eagle Rock CFO, 2026)
Typical AR Aging Distribution by Industry
Industry norms for aging bucket distribution (as % of total receivables):
| Industry | 0–30 Days | 31–60 Days | 61–90 Days | 90+ Days | Avg Bad Debt Rate |
|---|---|---|---|---|---|
| Technology/SaaS | 70–80% | 12–18% | 5–8% | 3–6% | 1–2% |
| Manufacturing | 60–72% | 15–22% | 8–12% | 5–10% | 2–4% |
| Wholesale | 65–75% | 14–20% | 7–11% | 4–8% | 1.5–3% |
| Healthcare | 50–65% | 15–25% | 10–18% | 18–22% | 3–6% |
| Construction | 45–60% | 15–22% | 10–18% | 8–15% | 3–8% |
| Professional Services | 60–72% | 16–22% | 8–13% | 5–10% | 2–4% |
Sources: D&B payment analysis, NACM Credit Manager’s Index, Atradius Payment Practices Barometer, Eagle Rock CFO (2026).
Bad Debt & Write-Off Statistics
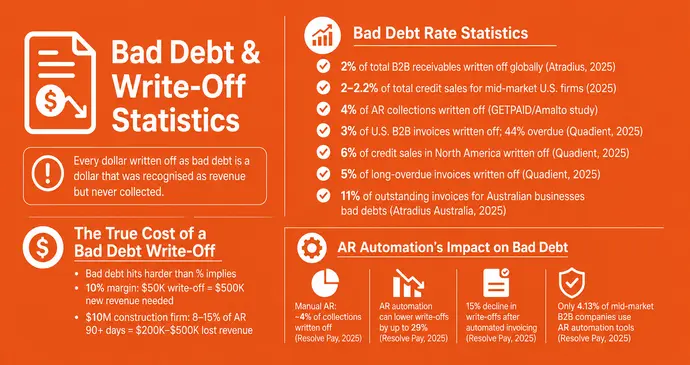
Every dollar written off as bad debt is a dollar that was recognised as revenue but never collected — while the cost of delivering the goods or service was already incurred.
Bad Debt Rate Statistics
- 2% of total B2B receivables are written off as uncollectible globally on average, according to Atradius (2025)
- 2–2.2% of total credit sales — the projected average bad debt write-off rate for mid-market U.S. firms in fiscal year 2025; for a $50M business, that is approximately $1M lost directly from the bottom line (Financial Models Lab, 2026)
- 4% of AR collections were written off as bad debt on average in a landmark GETPAID/Amalto study — a widely-cited baseline figure in AR benchmarking
- 3% of U.S. B2B invoices are written off as bad debts, with 44% currently overdue (Quadient, 2025)
- 6% of credit sales across North America are written off as bad debts (Quadient, 2025)
- 5% of long-overdue invoices are written off by U.S. companies (Quadient, 2025)
- 11% of outstanding invoices for Australian businesses constituted bad debts, per Atradius Australia (2025)
The True Cost of a Bad Debt Write-Off
Bad debt hits harder than its percentage implies. At a 10% net profit margin, writing off $50,000 in bad debt requires $500,000 in new revenue to replace the lost profit. At 20% margins, you still need $250,000 in additional revenue.
For a $10M construction company with 8–15% of AR in the 90+ day bucket, that translates to $200,000–$500,000 in annual revenue that never converts to cash (Eagle Rock CFO, 2026).
AR Automation’s Impact on Bad Debt
- Businesses that manage AR manually typically write off approximately 4% of collections as bad debt each year (Resolve Pay, 2025)
- AR automation can lower bad debt write-offs by as much as 29% through real-time credit risk evaluation and faster intervention (Resolve Pay, 2025)
- A 15% decline in write-off amounts has been reported by companies after implementing automated invoicing (Resolve Pay, 2025)
- Only 4.13% of mid-market B2B companies have adopted dedicated AR automation tools — leaving the vast majority exposed to preventable bad debt risk (Resolve Pay, 2025)
AR Automation Statistics
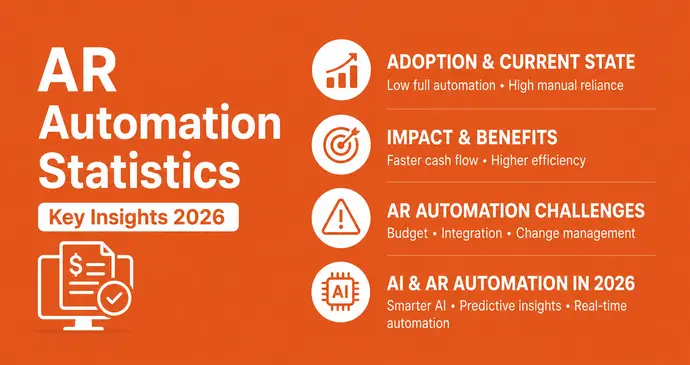
AR automation is the practice of using software to handle invoice delivery, payment reminders, cash application, dispute management, and collections workflows — reducing manual intervention and accelerating cash flow.
Adoption & Current State
- In 2026, only 8% of finance teams are fully automated, while 60–64% remain partially or significantly dependent on manual tasks (Parseur, 2026)
- Only 5% of AP/AR teams have fully automated their invoice and payment processes (InvoPilot Invoice Statistics Research, 2026)
- 86% of SMEs still enter invoice data manually (InvoPilot Invoice Processing Guide, 2026)
- Only 4.13% of mid-market B2B companies have adopted dedicated AR automation tools (Resolve Pay, 2025)
- More than 60% of CFOs planned to increase investment in finance automation in 2025, with AR among the highest-impact areas (Quadient, 2026)
- 81% of CFOs are turning to finance outsourcing or technology to modernise and optimise AR (Auxis, 2025)
- Nearly 65% of CFOs struggle to realise digital ROI from their current finance technology stack (Auxis, 2025)
- 92% of companies report experiencing faster cash flow after implementing AR automation software (Resolve Pay / Billtrust, 2025)
- 91% of mid-sized businesses using automated AR systems report improved cash flow (DocuClipper, 2025)
- AR automation accelerates payments by 40% according to research by Vanson Bourne commissioned by Billtrust
- AR teams can process core functions 87% faster with automation, and 79% say it boosts overall team efficiency (DocuClipper, 2025)
AR Automation Challenges
- Budget limitations cited by 29% of organisations as the primary barrier to automation (Parseur, 2026)
- Difficulty integrating AI with legacy ERP systems cited by 28% (Parseur, 2026)
- IT resource constraints and change management round out the top three barriers
AI and AR Automation in 2026
- AI-powered suites and generative AI agents now support invoice matching, collections outreach, and dispute handling at scale (Quadient, 2026)
- Predictive payment modeling forecasts payment dates at 85–92% accuracy and flags at-risk accounts 30–60 days before they miss a payment (Credit Pulse, 2025)
- Intelligent cash application auto-matches payments to invoices at 95–99% accuracy, cutting manual reconciliation time by 80–90% (Credit Pulse, 2025)
- Dynamic credit management adjusts credit limits in real time based on daily or weekly scoring updates rather than annual reviews (Credit Pulse, 2025)
For a practical look at the invoice side of AR, see InvoPilot’s guide to invoice processing and how to send an invoice efficiently to understand how the collection chain begins.
AR Automation ROI & Cost Savings
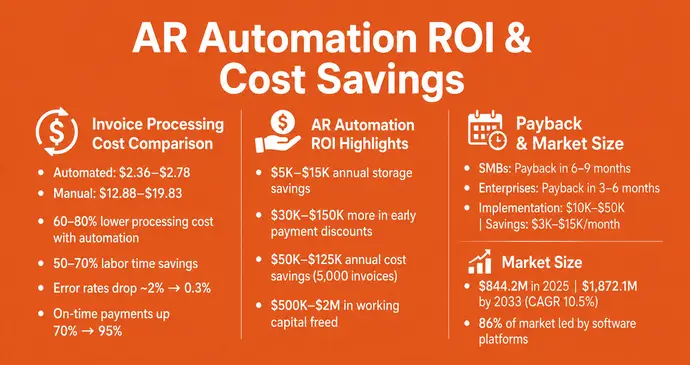
Invoice Processing Cost Comparison
One of the clearest ROI arguments for AR automation comes from invoice processing costs:
| Processing Method | Cost Per Invoice | Processing Time |
|---|---|---|
| Manual (industry average, 2025) | $12.88–$19.83 | 10–30 minutes |
| Best-in-class manual | $12.88 | 10–15 minutes |
| Electronic / automated | $2.36–$2.78 | 1–2 seconds |
Sources: APQC 2024, Ascend, Parseur 2025.
- Invoice automation eliminates 60–80% of manual processing costs (APQC, 2024)
- Manual processing averages $12–$30 per invoice; automated processing costs $1–$5 (APQC, 2024)
- Labor savings of 50–70% of time on invoice-related tasks after automation (Artsyl Tech, 2025)
- Error rates drop from ~2% to ~0.3% with automation — a 6.7x improvement in accuracy (Artsyl Tech, 2025)
- Paper storage costs $25–$35 per filing cabinet annually; digital storage costs just $0.10–$0.50 per invoice per year (Artsyl Tech, 2025)
- $5,000–$15,000 in annual storage savings from eliminating paper invoice archives (Artsyl Tech, 2025)
- On-time payment rates increase from 70% to 95% with automation, reducing vendor disputes by 40–60% (Artsyl Tech, 2025)
- $500K–$2M in working capital freed for companies with $50M+ revenue implementing full AR automation (ProcIndex, 2026)
- Early payment discount capture increases by up to $30,000–$150,000 annually for businesses processing 5,000+ invoices (Artsyl Tech, 2025)
- Organizations processing 5,000 invoices annually save $50,000–$125,000 in direct costs from automation, excluding productivity gains (Artsyl Tech, 2025)
AR Automation Payback Period
- SMBs typically achieve payback within 6–9 months after AR automation implementation (Parseur, 2026)
- Enterprises often see payback within 3–6 months due to higher invoice volumes and operational scale (Parseur, 2026)
- Implementation costs typically range from $10,000–$50,000, with monthly savings of $3,000–$15,000 (InvoiceAction by Artsyl, 2025)
AR Automation Market Size
- The U.S. accounts receivable automation market generated $844.2 million in revenue in 2025 (Grand View Research, 2026)
- Projected to reach $1,872.1 million by 2033, growing at a CAGR of 10.5% from 2026–2033 (Grand View Research, 2026)
- 86% of the AR automation market is dominated by software platforms designed to streamline end-to-end AR processes (DocuClipper, 2025)
Cash Flow Impact of AR Inefficiency
Accounts receivable management isn’t just about invoices — it is about the oxygen that keeps a business alive. The cash flow statistics are striking:
- $825 billion in outstanding receivables held by U.S. businesses at any given time (Crestmont Capital, 2026)
- Only 27 days of cash buffer — the average U.S. small business holds less than a month’s operating costs in reserve. A single delayed invoice can force borrowing, missed payroll, or delayed supplier payments (QuickBooks / ICAEW, 2025)
- Only 6% of manually processed invoices are paid within a month (DocuClipper, 2025)
- 38% of U.S. small businesses fail due to financial challenges, with late payment from customers identified as the leading cause by 60% of cash-strapped owners (Forbes / QuickBooks, 2025)
- SMBs spend an average of 4 hours per week chasing late payments — equating to 8.5 days per year of productive time lost to collections activities (DocuClipper, 2025)
- 5% of UK SMBs spend over 10 hours per week dealing with past-due invoices; an additional 9% spend 5–10 hours per week (QuickBooks UK, 2025)
- 17% of U.S. small businesses with unpaid invoices report the impact has become severe enough to threaten ongoing operations (QuickBooks, 2025)
See also: InvoPilot’s 70 Small Business Cash Flow Statistics for the most comprehensive cash flow data available for small businesses.
Invoice Error & Dispute Statistics
A significant proportion of late payments originate not from unwilling customers, but from invoice errors — errors that can and should be prevented.
- 61% of late payments are caused by incorrect invoices (GETPAID / Amalto)
- 11% of customers never received their invoice in a study of B2B billing practices (GETPAID / Amalto)
- 33% of surveyed Australian businesses cited invoicing their own customers late as a major reason for delayed payment — a completely self-inflicted problem (Atradius Australia, 2025)
- Incorrect invoices cost an average of $53.50 to reconcile on paper (Sterling Commerce benchmark)
- 78% of executives believed better communication could have resolved AR payment disputes (Wakefield / Versapay, 2022)
- 72% of executives felt their AR department was not customer-oriented enough, which directly impacts collections performance (Wakefield / Versapay, 2022)
- 53% of CFOs say that collaborative payment portals improve AR collections by reducing friction at the point of payment (DocuClipper, 2025)
- 20% of companies recognise the need to improve the soft skills of their AR teams, with a focus on business partnering (23%), oral communication (23%), and written communication (22%)
Understanding the difference between an invoice and a receipt is surprisingly important here — confusion at the document level contributes to disputes and delayed payments in many small business relationships.
AR Workforce & Process Statistics
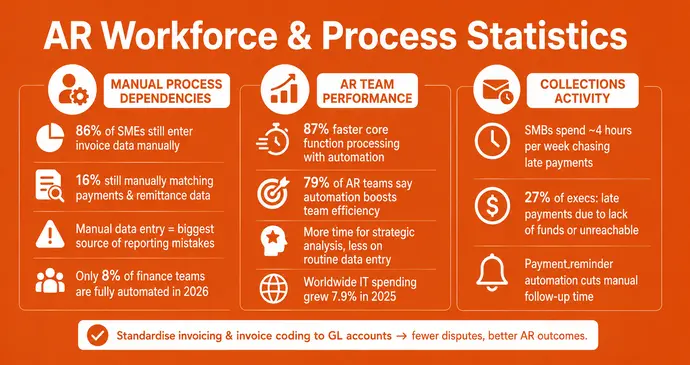
Manual Process Dependencies
- 86% of SMEs still enter invoice data manually (InvoPilot, 2026)
- 16% of AR teams were still manually matching payments and remittance data as recently as 2022 (DocuClipper citing Nuvo, 2025)
- Manual data entry creates the biggest source of mistakes in financial reporting — typing errors, missed decimal points, and wrong numbers in spreadsheets (Resolve Pay, 2025)
- In 2026, only 8% of finance teams are fully automated, while the majority remain dependent on manual tasks (Parseur, 2026)
AR Team Performance
- AR teams with automation can process core functions 87% faster than those relying on manual workflows (DocuClipper, 2025)
- 79% of AR teams say automation boosts overall team efficiency (DocuClipper, 2025)
- Finance teams with AR automation are freed to focus on strategic analysis rather than routine data entry (Resolve Pay, 2025)
- Worldwide IT spending grew 7.9% in 2025, reflecting continued enterprise investment in technology including AR (Gartner, 2025)
Collections Activity
- SMBs spend an average of 4 hours per week chasing late payments (DocuClipper / QuickBooks, 2025)
- 27% of financial executives report that late payments occurred because customers lack funds or are unreachable (DocuClipper, 2025)
- Payment reminder automation eliminates the majority of manual follow-up time and is cited as a primary driver of improved cash flow in businesses adopting AR software
For businesses looking to standardise their invoicing as a foundation for better AR, sales invoices and understanding how invoice coding connects to GL accounts can significantly reduce dispute rates.
AR KPIs Every Business Should Track
Understanding the statistics above is more valuable when you can measure your own performance. These are the key accounts receivable metrics every finance team should monitor:
The Core AR KPI Set
1. Days Sales Outstanding (DSO) The most widely used AR metric. Formula: (Accounts Receivable ÷ Total Credit Sales) × Number of Days. Target: below your industry average; ideally below 45 days for most B2B businesses.
2. Collections Effectiveness Index (CEI) Measures how efficiently your team converts invoices to cash. Formula: (Beginning AR + Monthly Credit Sales – Ending AR) ÷ (Beginning AR + Monthly Credit Sales – Ending AR from Bad Debt) × 100. A CEI of 80–90% is considered strong; 95%+ indicates excellent collection performance.
3. Accounts Receivable Turnover Ratio How many times per year your business collects its average AR balance. Formula: Net Credit Sales ÷ Average Accounts Receivable. Industry benchmarks (2023–2024 data):
- Retail: ~9.2x (NRF, 2022)
- Energy: ~9.8x (EIA, 2023)
- Wholesale: ~8.4x (U.S. Census, 2023)
- Healthcare: ~7.1x (HFMA, 2023)
- Manufacturing: ~6.8x (UNIDO, 2023)
- Automotive: ~6.2x (OICA, 2023)
- Technology: ~5.9x (Gartner, 2023)
- SaaS: ~5.4x (SaaS Capital Index, 2023)
- Construction: ~4.9x (ENR, Q4 2023)
4. Average Days Delinquent (ADD) Measures how many days past due your invoices are, on average. Formula: DSO – Best Possible DSO. A rising ADD is an early warning of collection deterioration.
5. Bad Debt to Sales Ratio The percentage of revenue that is written off as uncollectible. Formula: Bad Debt Write-Offs ÷ Total Credit Sales × 100. Industry average: 2–4% for most B2B sectors.
6. AR Aging Distribution The percentage of total AR in each aging bucket (Current, 31–60, 61–90, 90+). If more than 20% of your AR is aging past 60 days, your collections process needs attention.
7. DSO Efficiency Ratio Actual DSO ÷ Average Payment Terms. A ratio of 1.0–1.15 is excellent. Above 1.50 is a cash flow problem.
For deeper context on how these metrics connect to overall business profitability, see InvoPilot’s guide to EBITDA and net income.
Accounts Receivable Market Size Statistics
- U.S. AR Automation Market (2025): $844.2 million in revenue (Grand View Research, 2026)
- U.S. AR Automation Market (2033 Forecast): $1,872.1 million (Grand View Research, 2026)
- CAGR 2026–2033: 10.5% for U.S. AR automation (Grand View Research, 2026)
- Global accounts receivable financing market is growing across manufacturing, healthcare, retail, IT/telecom, transport/logistics, and other sectors (Research and Markets, 2025)
- 86% of the AR automation market is dominated by software platforms (DocuClipper, 2025)
Why the Market is Growing
- Cash flow remains a top concern for CFOs heading into 2026
- Cost of capital remains elevated; every day of freed DSO has direct monetary value
- AI-driven AR capabilities are now commercially accessible at SMB-friendly price points
- Regulatory complexity (e-invoicing mandates, tax compliance) is increasing the cost of manual processes
Global & Regional AR Statistics
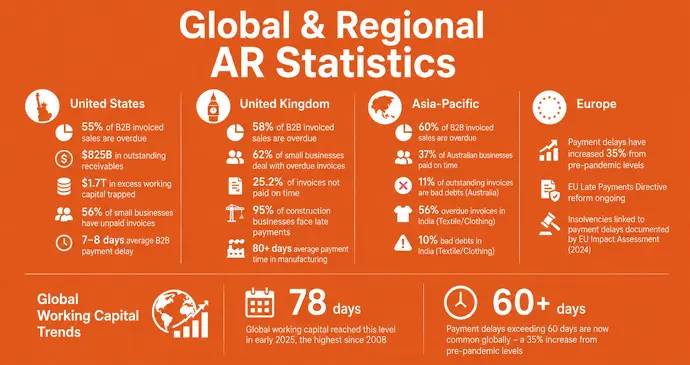
United States
- 55% of B2B invoiced sales are overdue (The Kaplan Group, 2025)
- $825 billion in outstanding receivables at any given time
- $1.7 trillion in excess working capital trapped in businesses (Quadient, 2025)
- 56% of small businesses have unpaid invoices outstanding, averaging $17,500 each (QuickBooks, 2025)
- Average B2B payment delay: 7–8 days beyond terms for most industries; 30–45 days in construction, healthcare, and government
United Kingdom
- 58% of B2B invoiced sales are overdue (DocuClipper / Atradius, 2025)
- 62% of small businesses deal with overdue invoices (QuickBooks UK, 2025)
- 25.2% of invoices issued by large UK businesses are not paid on time (UK Department for Business and Trade, 2025)
- Construction (UK): 95% of construction businesses experience late payments, with average delays of 38.2 days beyond agreed terms (Coface UK, 2025)
- Manufacturing (UK): Average payment time of 80+ days to suppliers
Asia-Pacific
- 60% of B2B invoiced sales are overdue in parts of Asia (DocuClipper / Atradius, 2025)
- Only 37% of Australian businesses had their invoices paid on time (Atradius Australia, 2025)
- 11% of outstanding invoices constituted bad debts for Australian businesses (Atradius Australia, 2025)
- India (Textile/Clothing): 56% of B2B transactions see overdue invoices; bad debts reach 10% (Atradius India, 2025)
Europe
- Payment delays have increased 35% from pre-pandemic levels across European markets (Credit Management News Digest, 2025)
- EU Late Payments Directive reform is ongoing; the European Commission’s Impact Assessment (2024) documented insolvencies directly attributable to inter-business payment delays
Global Working Capital Trends
- 78 days — global working capital reached this level in early 2025, the highest since 2008 (Quadient, 2025)
- Payment delays exceeding 60 days are now common across multiple sectors globally — a 35% increase from pre-pandemic levels
Frequently Asked Questions
What percentage of B2B invoices are paid late?
In the United States, approximately 55–61% of B2B invoiced sales are currently overdue or paid late, depending on the data source and methodology. Atradius reports that across North America, nearly half of B2B invoices remain overdue at any given time, with bad debts accounting for roughly 6% of credit sales.
What is the average DSO in the United States?
The average DSO varies significantly by industry. Most U.S. businesses target 30–45 days as a healthy benchmark. Engineering and construction companies average around 100 days — the highest of any sector. Food and staples retail averages just 11 days. The U.S. aggregate Cash Conversion Cycle improved to approximately 37 days in 2024 among large companies after a period of deterioration.
What is a good accounts receivable turnover ratio?
A higher AR turnover ratio is generally better, as it indicates faster collections. Retail and energy sectors typically see 9–10 turns per year. SaaS and construction companies see 4–6 turns. Always compare your ratio to your industry peers rather than a universal benchmark.
How much does AR automation save?
AR automation typically eliminates 60–80% of manual invoice processing costs, reduces DSO by 10–30 days, and decreases bad debt write-offs by up to 29%. SMBs typically see payback within 6–9 months; enterprises within 3–6 months.
What causes most AR disputes?
61% of late payments are caused by incorrect invoices. Other major factors include invoices never reaching the customer (11% of cases), customer cash flow problems, and poor communication between AR teams and customers. 78% of executives believe better communication could have resolved most disputes.
How long does it take to collect a debt over 90 days old?
Collection probability drops significantly once an invoice exceeds 90 days. Historical data puts collection rates for 90+ day receivables as low as 50%. Companies with more than 22% of AR in this bucket experience write-off rates 3–4 times higher than those with healthier aging profiles.
What is the average bad debt write-off rate?
The global average is approximately 2% of total B2B receivables written off as uncollectible, according to Atradius. Mid-market U.S. firms are projected to write off 2–2.2% of credit sales in 2025. Manual AR processes correlate with bad debt rates closer to 4%.
Summary: The 20 Most Important AR Statistics for 2026
| # | Statistic | Source |
|---|---|---|
| 1 | 55% of U.S. B2B invoiced sales are overdue | The Kaplan Group, 2025 |
| 2 | $825B in outstanding U.S. receivables at any time | Crestmont Capital, 2026 |
| 3 | $1.7T in excess working capital trapped in U.S. businesses | Quadient, 2025 |
| 4 | 61% of B2B invoices in the U.S. are paid late | Crestmont Capital, 2026 |
| 5 | Average B2B payment time: 47 days vs. 30-day terms | Credit Management Review, 2025 |
| 6 | 61% of late payments caused by incorrect invoices | GETPAID / Amalto |
| 7 | 56% of U.S. small businesses owed ~$17,500 in unpaid invoices | QuickBooks, 2025 |
| 8 | Global working capital hit 78 days in 2025 (highest since 2008) | Quadient, 2025 |
| 9 | Engineering & Construction DSO: ~100 days (highest sector) | Centime, 2026 |
| 10 | Accounts 90+ days old have collection rates as low as 50% | Resolve Pay, 2026 |
| 11 | Global average bad debt write-off: ~2% of B2B receivables | Atradius, 2025 |
| 12 | Only 8% of finance teams are fully automated (2026) | Parseur, 2026 |
| 13 | AR automation reduces DSO by 10–30 days | ProcIndex, 2026 |
| 14 | Manual invoice cost: $12.88–$19.83 vs. $2.36–$2.78 automated | APQC, 2024 |
| 15 | 92% of companies report faster cash flow after AR automation | Billtrust / Resolve Pay, 2025 |
| 16 | AR automation reduces bad debt write-offs by up to 29% | Resolve Pay, 2025 |
| 17 | U.S. AR automation market: $844.2M (2025) → $1.87B (2033) | Grand View Research, 2026 |
| 18 | 70% of finance teams cite DSO as their primary cash flow challenge | Resolve Pay, 2025 |
| 19 | Payback on AR automation: 3–9 months | Parseur, 2026 |
| 20 | Every 10-day DSO reduction = ~$1.37M freed for a $50M company | Credit Pulse, 2025 |
What These AR Statistics Mean for Your Business
The data tells a clear story: most businesses are losing real money to preventable AR problems. Whether it is incorrect invoices triggering disputes, invoices never reaching the customer, or collections teams with no automated follow-up — the cost is measurable and the solutions exist.
Here is where businesses can act today:
1. Fix your invoice accuracy first. Since 61% of late payments originate from invoice errors, improving invoice processing and ensuring proper invoice coding reduces disputes at the source.
2. Send invoices faster. Businesses that invoice late get paid late — 33% of delayed payments are entirely self-inflicted. Explore how to send invoices efficiently using structured digital workflows.
3. Track DSO relative to your industry. A DSO that looks average may be catastrophic relative to your sector. Use the benchmarks in this article to benchmark your performance honestly.
4. Act on aging quickly. Once an invoice crosses 90 days, your chance of full collection drops below 50–65%. Early, automated follow-up at 7, 14, and 30 days post-due dramatically improves outcomes.
5. Quantify the cost of delay. For a $50M business, cutting DSO by 10 days frees approximately $1.37M in working capital — without adding a single new customer.
Tools like InvoPilot’s free invoice generator make it straightforward to create accurate, professional invoices instantly — eliminating one of the most common and preventable root causes of late payment.
Sources & Methodology {#sources}
This article compiles and synthesises data from the following primary and secondary research sources. Where statistics appear across multiple sources, the most conservative or most recent figure has been used. All statistics attributed to primary research organisations are cited directly; all secondary compilations are noted with their original source.
Primary Research Sources:
- Atradius Payment Practices Barometer 2025 — B2B payment behaviour across 40+ countries
- QuickBooks 2025 U.S. Small Business Late Payments Report — 2,000+ U.S. small business survey
- Quadient AR Statistics Research (2025) — D&B, Atradius, Federal Reserve data
- APQC Finance Function Benchmarking 2024
- NACM Credit Manager’s Index
- Grand View Research U.S. AR Automation Market Outlook 2026
- The Kaplan Group 54 B2B Payment Delay Statistics 2025
- Versapay AR Research
- HighRadius AR Research
- Gartner Technology Industry AR Data 2023
- NRF Retail AR Data 2022