The global B2B payments market is valued at over $109 trillion in 2026 and is projected to reach $282 trillion by 2034. Paper checks still account for 25–31% of B2B payments globally. Over 64% of businesses process the majority of payments electronically. Cross-border payments take 55% longer to settle than domestic ones. India’s B2B payments market is on track to surpass $1 trillion, fueled by UPI and GST-linked digital rails.
Why B2B Payment Statistics Matters Alot
Every year, trillions of dollars move invisibly between businesses across bank wires, ACH rails, virtual cards, and yes, still paper checks. But most finance teams, procurement leads and business owners are making payment decisions based on gut instinct, not data.
That changes with this guide.
This is not another list of recycled statistics aggregated from a single market research PDF. Every section here digs into the why behind the numbers, what they mean operationally, where the friction lives and what smart businesses are doing about it.
Whether you’re a CFO rethinking your AP workflow, an SMB owner trying to stop chasing unpaid invoices, or a finance tech founder benchmarking your market, this is the most complete actionable B2B payment data resource available in 2026.
Global B2B Payments Market Size & Growth
The B2B payments space is astronomically larger than most people realize. Retail payments, the kind consumers make every day, are a small fraction of what businesses transfer between themselves annually.
Market size at a glance:
| Metric | Figure |
|---|---|
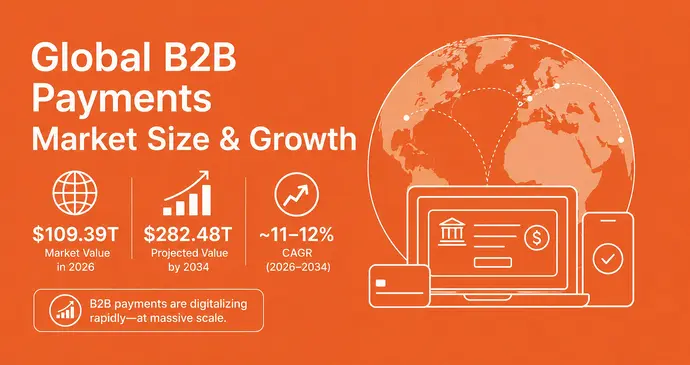
| Global B2B payments market value (2026) | $109.39 trillion |
| Projected market value by 2034 | $282.48 trillion |
| CAGR (2026–2034) | ~11–12% |
| Juniper Research total transaction value (2025) | $187 trillion |
| Juniper Research projected transaction value (2030) | $224 trillion |
| B2B digital payments market (current) | $4.6 billion (platform/software layer) |
| B2B digital payments market projected by 2032 | $213 trillion+ (total transaction rails) |
Sources: Fortune Business Insights, Juniper Research, IMARC Group, Custom Market Insights
What these numbers actually mean:
The headline “trillion-dollar” figures refer to total transaction value, the cumulative sum of all money moved between businesses globally. It includes trade finance, inter-company transfers, supply chain payments, and accounts payable settlements.
The “digital payments platform” market ($4.6 billion growing to $213 trillion in transaction value) refers to the software and fintech infrastructure layer, a much smaller but faster-growing segment.
Regional breakdown:
- North America commands approximately 40% of global B2B payment volume, driven by large enterprise activity, ACH dominance, and a mature banking infrastructure.
- Asia-Pacific is the fastest-growing region, with India and Southeast Asia leading the charge. Government-mandated digital rails (UPI, PromptPay, PayNow) are accelerating commercial adoption.
- Europe is undergoing significant transformation as the EU’s SEPA Instant Credit Transfer mandate (effective January 2025) pushes banks toward real-time settlement.
- Latin America and Middle East/Africa are emerging markets where mobile-first B2B payment adoption is outpacing traditional banking.
The trajectory is clear: B2B payments are digitalizing rapidly, but the pace varies enormously by region, business size, and sector.
What B2B Payment Methods Businesses Actually Use
Despite decades of digital transformation promises, the B2B payments world remains surprisingly fragmented. Here’s how payment method usage actually breaks down.
North America payment method split:
| Payment Method | Share of B2B Payments |
|---|---|
| ACH Credit Transfers | 37% |
| Paper Checks | 25% |
| Domestic Wire Transfers | 13% |
| Virtual Cards | 8% |
| Other (cash, money orders, digital wallets) | 17% |
Source: Zomentum / NACHA
Global check usage:
- Paper checks are still used for approximately 31% of B2B invoices globally, though the figure is closer to 25% in North America (down from 42% in 2019).
- The check is declining but has proven stubbornly resistant to elimination, largely because many legacy ERP systems and AP departments are built around check-based workflows.
- At current rates of decline, paper checks are projected to account for less than 15% of B2B payments by 2030 in mature markets.
The ACH story:
ACH (Automated Clearing House) has become the dominant B2B payment rail in the United States. NACHA reported 8.08 billion B2B ACH payments in 2025, transferring $63.11 trillion year over year growth of 9.9% in payment count and 8.4% in dollar volume.
For context: ACH B2B payments grew by approximately $4.9 trillion in a single year. That’s larger than the entire GDP of Japan.
Wire transfers vs. ACH:
Wire transfers remain the default for large, time-sensitive, or international B2B payments particularly for amounts over $1 million. ACH dominates routine, recurring AP flows (payroll, vendor payments, subscription billing) where settlement within one to two business days is acceptable.
Virtual cards:
The quiet winner in B2B payments innovation is the virtual card. Usage has grown over 30% year on year among mid-market enterprises, driven by:
- Built-in spend controls and single-use card numbers
- Cash rebates (typically 0.5 to 1.5% of transaction value)
- Automatic reconciliation with ERP systems
- Fraud prevention relative to ACH or wire
Invoice Statistics: The Hidden Cost of Paper-Based Billing
B2B payments begin with invoices. And invoices in most organizations are still deeply manual, error-prone, and slow. Our invoice statistics overview covers the full picture, here we pull the data most relevant to payment flows.
Invoice volume and process:
- The average business processes approximately 500 invoices per month
- 66% of businesses spend more than 5 days per month just processing invoices
- 86% of SMEs still enter invoice data manually, despite automation being widely available
- Only 52% of invoices are received electronically, the rest are still paper-based
Invoice errors and their payment impact:
- 61% of late B2B payments are traced directly to incorrect invoice data, wrong PO numbers, mismatched amounts, missing tax codes
- Enterprises are most likely to require 6 or more approvals and take 3 to 4 weeks to approve a single invoice
- A single invoice error in a complex supply chain can delay payment by 15 to 30 days and require 3 to 7 manual touchpoints to resolve
The cost of paper invoicing:
- Processing a paper invoice costs between $12 and $30 per document (including labor, postage, storage, error correction)
- Processing an electronic invoice costs $3 to $8 per document
- Transitioning to e-invoicing can save businesses up to £10 per invoice in the UK, roughly $12–13 USD
- E-invoicing across US federal government procurement alone could save an estimated $450 million annually
The math is unambiguous. Yet adoption remains incomplete largely because of legacy system inertia and the perceived complexity of transition.
Understanding electronic invoicing is the first step toward closing this gap. For businesses still on paper, even moving to structured PDF invoices with standardized invoice payment terms reduces processing time by an average of 60%.
Late Payments: The $3.1 Trillion Problem
Late B2B payments are an existential threat to small businesses and a systemic friction point for global trade.
The scale of the problem:
- 55% of all B2B invoices in the United States are paid late, only 36% on time, with 9% written off entirely (Atradius)
- Small businesses in the US receive payments an average of 8 days past the due date
- SMEs collectively spend 14 hours per week chasing overdue payments, time that could be spent on revenue-generating activity
- 38% of small businesses that fail cite late payment-induced cash flow problems as a primary cause (Forbes)
Late payment data by region:
| Region | Average Days Late | % of Invoices Paid Late |
|---|---|---|
| United States | 8 days | 55% |
| United Kingdom | 6.3 days | 50% |
| Europe (average) | 13 days | 44% |
| Asia-Pacific | 18 days | 48% |
| Latin America | 22 days | 62% |
Why B2B payments are late — the real reasons:
Most discussions of late payments focus on buyer bad faith. The data tells a more complex story:
- Invoice errors (missing PO number, wrong amount, incorrect tax) — responsible for 61% of delays
- Slow internal approval chains — 3–4 weeks average in enterprises with 6+ approval levels
- Cash flow management by payers — deliberately stretching payment to 60–90 days
- Dispute resolution delays — average B2B payment dispute takes 29 days to resolve
- Lack of visibility — 47% of vendors report no transparency into where their payment is in the approval process
Understanding late invoice payment patterns in your specific industry is the foundation of building a more resilient receivables strategy.
The cascading effect:
Late B2B payments create a chain reaction. A supplier paid 30 days late may pay their own suppliers late. That supplier delays a third-party service. One late payment ripples across three or four businesses. This interconnected vulnerability is estimated to suppress global GDP by 0.5 to 1% annually.
Cross-Border B2B Payments
As global trade expands, more B2B payments cross borders and crossing borders means confronting a payment system that was not designed for speed, transparency, or cost efficiency.
Key cross-border B2B statistics:
- Cross border B2B payments take 55% longer to settle than equivalent domestic transfers
- 54% of global companies cite payment speed as the primary factor when choosing a cross-border payment solution
- The average cost of a cross-border B2B wire transfer is $25 to $50 per transaction, not including FX conversion margin (typically 1 to 3%)
- $156 trillion in cross border payments are projected by 2030, with B2B representing approximately 65% of that volume (McKinsey Global Payments Report)
Where the friction lives:
Cross border B2B payments fails or slow down for several specific reasons:
- Correspondent banking chains: A payment from India to Brazil may pass through 4 to 6 correspondent banks each adding delay and fees.
- SWIFT MT103 limitations: The legacy SWIFT messaging format used in most wire transfers carries limited remittance data, making reconciliation difficult.
- Compliance screening: AML/KYC checks at each correspondent bank add 24 to 72 hours per leg
- Currency conversion timing: Businesses frequently lose 1 to 3% of transaction value to FX spread which compounds dramatically at scale.
- Time zone misalignment: A payment initiated in Singapore at 5 pm will not be processed in New York until the following business day.
The emerging alternatives:
New payment rails are beginning to address these structural problems:
- SWIFT gpi (Global Payments Innovation): Now covers 65% of cross-border SWIFT traffic, reducing settlement to same day in most corridors.
- Ripple / XRP Ledger: Used by select financial institutions to settle cross-border payments in 3 to 5 seconds.
- Stablecoins: Several multinationals are piloting USDC and USDT for supplier payments in regions with volatile local currencies.
- Bilateral instant payment linkages: India-Singapore (UPI-PayNow), India-UAE (UPI-AANI), and EU-UK SEPA bridges are creating real time cross border lanes for the first time.
For businesses generating international sales, the difference between a fast cross-border payment solution and a slow one can mean the difference between working capital availability and a cash flow crisis. A well-structured proforma invoice at the start of an international transaction is one of the most practical tools for avoiding customs delays and payment disputes.
Real Time & Digital Payment Adoption in B2B
Real-time payments (RTP) instant settlement, 24/7/365 were once a consumer payments feature. They are now reshaping B2B.
Digital payment adoption statistics:
- Over 64% of companies made more than 1/2 of their B2B payments electronically in 2022 up from 45% in 2019
- Only 28% of businesses still make the majority of payments manually or by check
- B2B transactions using real-time payment rails are projected to reach 18 billion by 2030 (Juniper Research)
- The global real time payments market (including B2B) is growing at a CAGR of over 33%
Country-by-country real-time B2B adoption:
| Country | Real-Time B2B Payment Status | Key Rail |
|---|---|---|
| India | Advanced — mandated for GST compliance | UPI, IMPS |
| USA | Growing — FedNow launched 2023, RTP by The Clearing House | FedNow, RTP |
| UK | Mature — Faster Payments active since 2008 | Faster Payments |
| EU | Transitioning — SEPA Instant mandatory from Jan 2025 | SEPA Instant |
| Brazil | Rapid growth — Pix launched 2020 | Pix |
| Singapore | Advanced — PayNow connected to India UPI | PayNow |
| Australia | Established | NPP/Osko |
The B2B digital payments platform market:
Software market who manages B2B digital payments (AP automation, e-invoicing, payment orchestration) is distinct from the transaction value figures above. This platform market was valued at $4.6 billion in 2024 and is projected to reach the multi-trillions in transaction throughput by 2032 driven by enterprise adoption of AP automation, virtual card programs, and payment reconciliation tools.
What’s driving the shift:
- Remote Work – Paper check workflows brake down during COVID and many businesses never rebuilt them
- ERP Integrations – Modern ERPs (SAP, Oracle, NetSuite) natively support ACH, wire, and virtual card payment flows
- Working Capital optimization — Faster payment settlement improves cash flow visibility
- Fraud Pressure – Check fraud surged 65% in 2023 businesses are moving to safer digital alternatives
- Supplier Demands – Large vendors increasingly require ACH or electronic payment as a condition of business
India B2B Payments Statistics
India represents one of the most dynamic B2B payment transformations happening anywhere in the world. The combination of government policy, digital infrastructure, and a massive SME economy is creating a genuinely new payments ecosystem.
India B2B market size:
- India B2B payments market is on track to surpass $1 trillion in total transaction value
- The Corporate Flows B2B Payment Market in India includes institutional and enterprise flows was valued at $810,852.8 million in 2024 projected to reach $1,594,082.9 million by 2033 at a CAGR of 7.8%
The UPI revolution in B2B:
UPI (Unified Payments Interface) was originally designed for consumer payments and now become a foundational B2B payment rail in India:
- UPI processed over 13.1 billion transactions in March 2025 not all B2B, but commercial adoption is growing rapidly
- The RBI has been actively extending UPI infrastructure for business use cases, including UPI for business (UPI B2B), GST-linked payment triggers, and credit on UPI for trade finance
- UPI is now linked to Singapore’s PayNow and UAE’s AANI system, enabling real-time cross-border settlement for Indian exporters
GST and e-invoicing mandate:
India’s GST e-invoicing mandate which requires businesses above a certain turnover threshold to generate invoices through the IRP (Invoice Registration Portal) has transformed B2B payment data quality:
- Businesses subject to the mandate generate invoices with a unique IRN (Invoice Reference Number) that auto-populates GST returns and buyer AP systems
- E-way bill integration means goods movement is automatically linked to payment status
- The mandate has progressively lowered the turnover threshold from ₹500 crore (2020) to ₹5 crore (2023), bringing the vast majority of medium and large Indian businesses into the e-invoice ecosystem
For Indian businesses navigating GST compliance, the GST Calculator and structured invoice workflows are essential daily tools.
India’s unique B2B payment challenges:
Despite rapid digitalization, Indian B2B payments face specific friction points:
- Credit access for SMEs: Working capital credit for B2B trade is still largely collateral-dependent; UPI based credit is emerging but not yet at scale
- TDS compliance complexity: Tax Deducted at Source requirements create additional documentation burden on B2B payments
- Payment terms vs. practice: Standard Indian B2B payment terms are Net 30 to 60 days, but actual payment often takes 90 to 120 days in practice, creating significant working capital gaps
SMB-Specific B2B Payment Pain Points
Small and medium-sized businesses experience B2B payment friction very differently from large enterprises. The data reveals a pattern of structural disadvantage that compounds over time.
As payers (buying from suppliers):
- 45% of SMBs struggle with the requirement to manually review and approve invoices before payment — a process designed for enterprise scale, not small team capacity
- 43% of SMBs cite the high cost of credit (business credit cards, overdrafts, invoice financing) as a primary barrier to maintaining supplier relationships
- SMBs are significantly more likely to be required to prepay or pay on delivery reducing their working capital advantage relative to larger buyers
As vendors (receiving payment from customers):
- 47% of vendors — predominantly SMBs report a complete lack of transparency about where their invoice is in the buyer’s approval process
- 44% of SMB vendors point to long invoice approval delays as their top payment pain point
- SMBs receive on average 8 more days of payment delay than their enterprise counterparts, despite having fewer resources to absorb that delay
The invoice quality connection:
The single most actionable insight from B2B payment research is that invoice quality directly drives payment speed. SMBs that send structured, complete, error-free invoices with clear payment terms get paid measurably faster.
The critical elements:
- Clearly stated payment terms (Net 15, Net 30, 2/10 Net 30) — see our guide to invoice payment terms
- Accurate PO number or project reference
- Itemized line items with correct tax calculation
- Bank details prominently displayed
- A unique, sequential invoice number for easy tracking
Businesses that moved from informal invoicing to structured formats using tools like InvoPilot’s free invoice generator report a measurable reduction in payment queries and disputes.
SMB cash flow impact:
- SMBs with more than 15% of receivables overdue by 60+ days have a 3x higher probability of experiencing a cash flow crisis within 12 months
- The average UK SMB is owed £22,000 in late payments at any given time
- 38% of small business failures are directly linked to cash flow problems caused by late B2B payments
The accounts receivable statistics picture reinforces a single message: invoice-to-cash speed is an existential variable for small businesses, not a bookkeeping detail.
B2B Payments Automation Statistics
The gap between where B2B payment automation is and where it needs to be is one of the most significant operational opportunities in business finance.
Current automation adoption:
- Only 5% of AP teams have fully automated their invoice and payment processes — a strikingly low figure given the availability of automation tools
- 26% of businesses planned to achieve full AP automation by 2024 — most have not yet succeeded
- 41% of businesses with partial automation have automated invoice approvals (the highest-value single step to automate)
- 88% of finance teams believe AP automation would free them to focus on strategic initiatives rather than data entry
What’s being automated (and what isn’t):
| AP Process | Automation Rate |
|---|---|
| Invoice receipt | 38% |
| Invoice data extraction (OCR) | 31% |
| PO matching | 28% |
| Invoice approval routing | 41% |
| Payment execution | 22% |
| Payment reconciliation | 19% |
The data reveals a critical gap: many businesses have automated invoice receipt but not the downstream steps (approval, payment, reconciliation) that determine actual payment speed.
The ROI of automation:
- Fully automated AP teams process invoices at approximately 4x the speed of manual teams
- Cost per invoice processed drops from $12–30 (manual) to $2–5 (automated)
- Automated AP teams have doubled in prevalence over two years (from 4.5% to 9% fully automated)
- Payment error rates drop by approximately 67% in organizations with full AP automation
Barriers to automation adoption:
- Legacy ERP limitations — older systems require significant customization to support modern payment rails
- Data quality issues — unstructured incoming invoices (PDFs, emails, faxes) require OCR/AI to process
- Supplier diversity — large buyers receive invoices in dozens of formats; normalization is non-trivial
- Change management — finance teams with deep manual workflows often resist automation from a skills-preservation instinct
Understanding invoice processing workflows in depth is the prerequisite for identifying where automation delivers the highest return.
Key B2B Payment Statistics Summary Table
Here is a single-reference table of the most important B2B payment statistics from this guide:
| Category | Statistic |
|---|---|
| Global market value (2026) | $109.39 trillion |
| Projected market value (2034) | $282.48 trillion |
| Market CAGR | 11–12% |
| NACHA B2B ACH payments (2025) | 8.08 billion / $63.11 trillion |
| ACH YoY payment volume growth | 9.9% |
| Paper check share of B2B payments | 25–31% |
| Electronic payment adoption (majority of payments) | 64% of businesses |
| Cross-border settlement delay vs. domestic | 55% longer |
| Primary cross-border selection factor | Speed (54% of companies) |
| Invoices paid late (US) | 55% |
| Average days late (US SMBs) | 8 days |
| Invoice errors causing payment delay | 61% of late payments |
| Average enterprise invoice approval time | 3–4 weeks |
| Cost per manual invoice | $12–30 |
| Cost per e-invoice | $3–8 |
| Full AP automation rate | 5% |
| SMBs citing lack of settlement transparency | 47% |
| India B2B market trajectory | $1 trillion+ |
| Real-time B2B transactions projected (2030) | 18 billion |
What To Do With This Data: Practical Actions for 2026
Statistics without application are trivia. Here is what the B2B payment data actually recommends for different business profiles:
If you’re an SMB owner or freelancer:
The single highest ROI action is improving invoice quality. Structured, complete invoices with clear payment terms sent immediately upon delivery, pay faster than informal ones. Tools like InvoPilot’s free invoice generator eliminate the most common invoice errors automatically. Pair structured invoices with explicit payment terms even a standard Net 30 with a 2% early payment discount reduces your average collection time.
If you’re managing a B2B company’s procurement:
Move from check to ACH for routine vendor payments. The cost savings (lower transaction fees, better reconciliation) are material. For suppliers you rely on, consider setting up virtual card programs — you earn rebates, they get faster payment, everyone wins.
If you’re operating cross-border:
Evaluate your FX and wire transfer costs on an annualized basis. Businesses transferring over $1 million annually internationally should be using a specialist FX provider (Wise Business, Airwallex, Convera) rather than bank wire for routine flows. For Indian exporters specifically, the UPI-linked international rails are now viable for Southeast Asia and Gulf corridors.
If you’re building or evaluating a fintech product:
The data reveals the highest-opportunity gaps: SMB cross-border payments, AP automation for the mid-market (companies processing 200–2,000 invoices per month who have outgrown spreadsheets but can’t afford enterprise software), and trade finance for underserved geographies.
For subscription-based B2B businesses, understanding prorated billing mechanics and having invoice infrastructure that automates mid-cycle adjustments is increasingly a competitive differentiator.
Frequently Asked Questions
What is the current size of the global B2B payments market?
The global B2B payments market is valued at approximately $109.39 trillion in 2026, according to Fortune Business Insights. It is projected to grow to $282.48 trillion by 2034 at a CAGR of approximately 11 to 12%.
What percentage of B2B payments are still made by paper check?
Approximately 25–31% of B2B payments globally are still made by paper check in 2026 depending on the region. In North America, the figure is approximately 25% down from 42% in 2019. ACH credit transfers (37%) have surpassed checks as the most common B2B payment method in the US.
How long do cross-border B2B payments take to settle?
Cross-border B2B payments take approximately 55% longer to settle than equivalent domestic transfers. Depending on the corridor and payment method, cross-border settlement can take between 1 and 5 business days, compared to same-day or next-day for domestic ACH.
What percentage of B2B invoices are paid late?
In the United States, 55% of B2B invoices are paid late with 36% paid on time and 9% written off entirely (Atradius research). Small businesses receive payment an average of 8 days past the invoice due date.
What is the most common cause of B2B payment delays?
Invoice errors are the most common cause of B2B payment delays responsible for 61% of late payments. The most frequent errors include incorrect PO numbers, mismatched amounts, missing tax codes, and unclear payment terms.
How much does it cost to process a B2B invoice manually vs. electronically?
Manual invoice processing costs between $12 and $30 per invoice, including labor, error correction, and storage. Electronic invoice processing reduces this to $3–8 per invoice. Organizations with full AP automation report an additional reduction to $2–5 per invoice.
What is the B2B payment automation rate among businesses?
Only 5% of accounts payable teams have fully automated their invoice and payment processes as of the most recent data. However, 41% of businesses with partial automation have automated the invoice approval step, and 88% believe full automation would significantly improve their finance team’s strategic output.
What is driving B2B payments growth in India?
India’s B2B payments growth is primarily driven by the UPI (Unified Payments Interface) infrastructure, GST e-invoicing mandates, and government-backed digital payment initiatives. India’s B2B payments market is projected to exceed $1 trillion in total transaction value, supported by cross-border real-time payment linkages with Singapore, UAE, and other markets.